A redesign of the ATL311 platform to improve community reporting and compliance. Focused on geotagged reports, standardized checklists, and real-time transit updates.
Role
UX Designer, Researcher, UI Animator
Team
6 people
Duration
Feb 2025 – Apr 2025

Explore the
Figma
File
Overview
A mobile-first reporting platform that modernizes non-emergency city service requests for Atlanta residents. InCity streamlines how people submit geotagged reports, track progress, and receive real-time city updates. Promoting transparency and community involvement.
Project Overview
In February 2025, my team and I set out to refine ATL 311 into a mobile-first app. InCity was then set to make what makes reporting non-emergency issues as simple as texting a friend. As the lead UX Designer, I owned the end-to-end experience: motion graphics, wireframing, prototyping, UI animation, and everything in between.
Working with a six-person team, we focused on geotagged reports, standardized checklists, and live MARTA updates—all wrapped in dark/light modes and variable font-size settings for true accessibility.
Problem Statement
Though out interviews with residents of Atlanta and a deep dive into the city's existing 311 site revealed three failings: buried categories, zero status transparency, and a mobile UI that felt like an afterthought. Residents filed potholes, graffiti, or trash requests…and then heard nothing back. We set out to restore trust by making each step crystal clear.
Goals & Success Metrics
Primary Goals: Simplify report submission; Increase clarity around request status; Improve mobile usability.
Success Metrics: 28% increase in user engagement (prototype testing); 40% faster average issue resolution (projected by pilot); Reduced form abandonment by 35%.
Research & Competitive Audit
I audited a dozen peer cities (MyColaSC, Austin311, NYC311, etc.) to spot best practices—like MyColaSC’s progress updates and NYC 311’s user flow, and then talked directly to users of the ATL311 app. In five remote interviews we spoke to residents and Marty Hughes, Assistant City Manager of Kennesaw, GA, who shared his intake on the benefit this take on a reporting app could have in the city. Those insights shaped our journey maps and IA diagrams.

Bringing “Blake” to Life
We created “Blake,” a 49-year-old Parks & Rec administrator in Kennesaw, GA, who wakes up to a tidal wave of manual 311 requests and no easy way to share updates with constituents.
Goals:
Educate citizens about 311 services
Use limited budget on critical needs
Track and resolve claims without manual sorting
Snapshot:
Each morning, Blake reviews hundreds of 311 reports by hand and has no way to share real-time status with residents. She needs a simple dashboard to log, assign, and update requests so the city can stay efficient and transparent.
User Journey & Information Architecture
Simplified journey from landing to report submission and update.
Some improvements include:
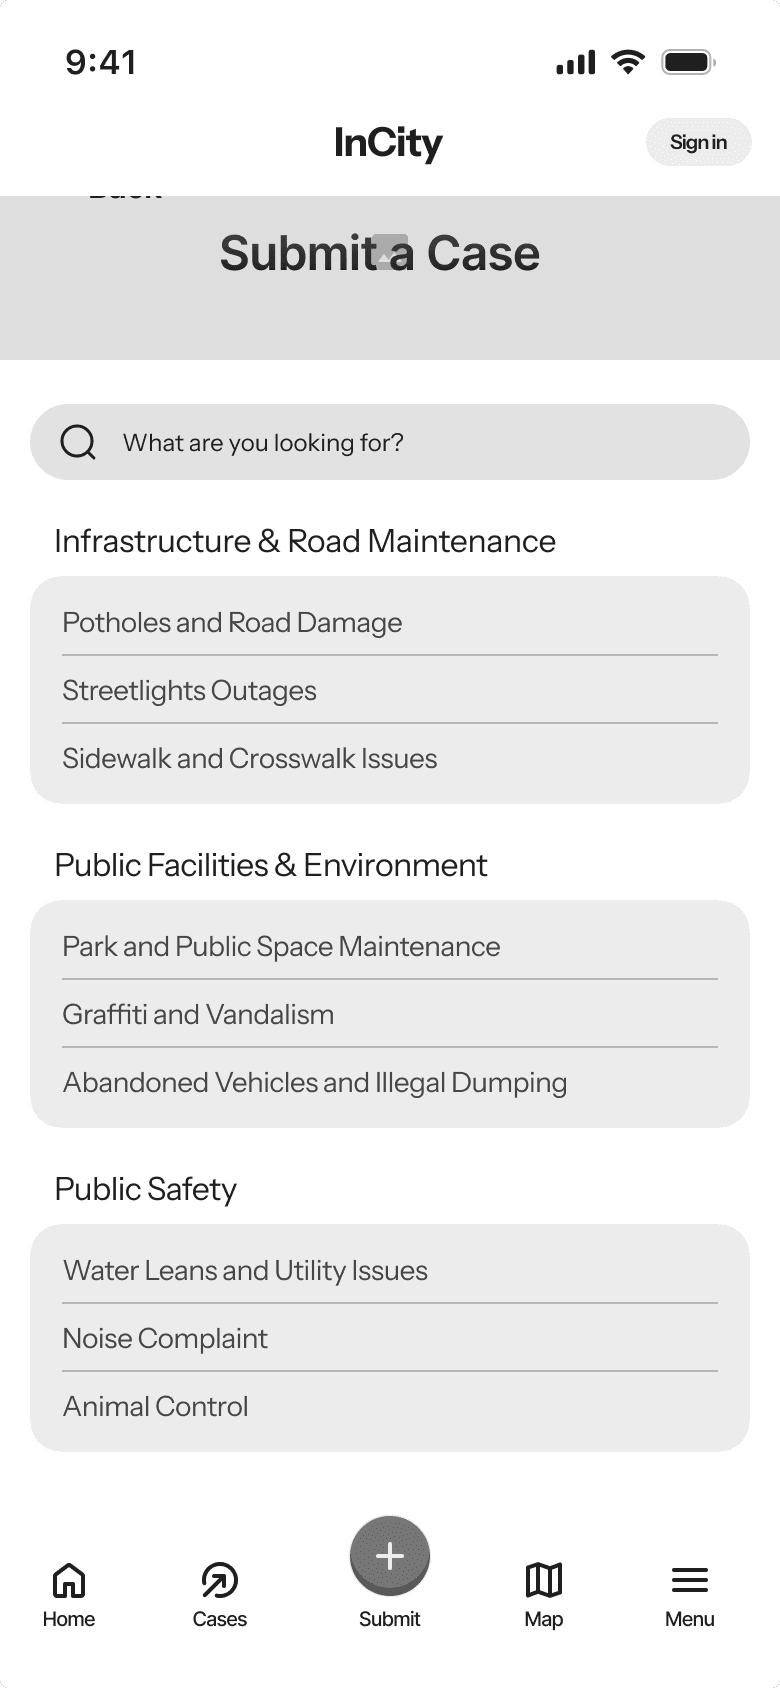
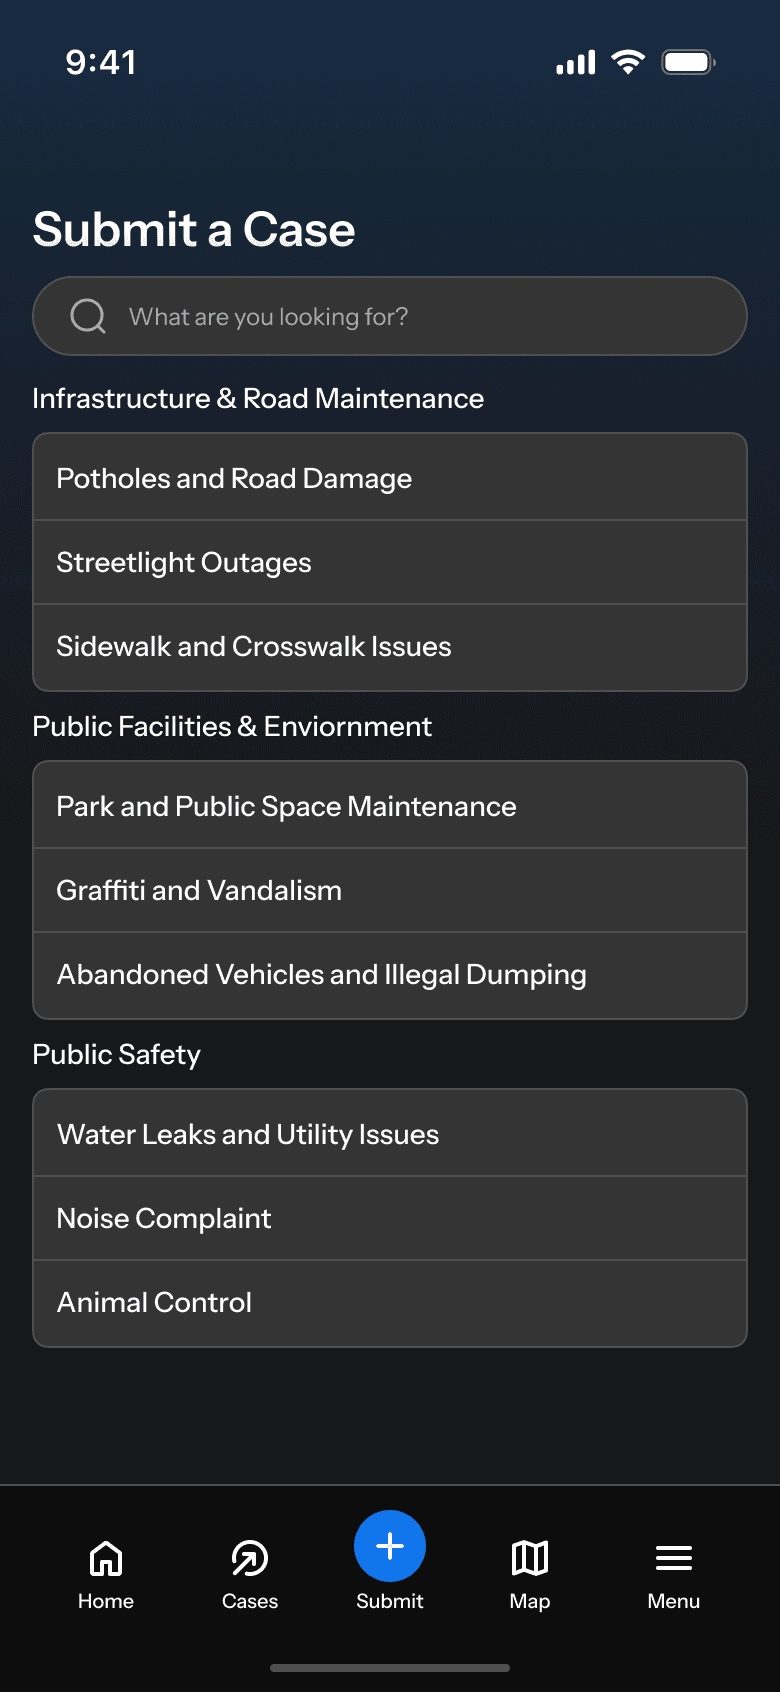
Combined category and description into one screen with icon-driven categories
Consideration into accessibility settings such as: Dark/Light Mode, Font Resizing
Drag


Wireframes
My team and I got to work developing the lo-fi wireframes, drawing inspiration from bento-style layouts for clearer visual organization. We sketched core screens—Home, My Cases, Submit, Map, Settings—mapping out the flow without distractions, so we could refine information architecture rapidly.
Drag

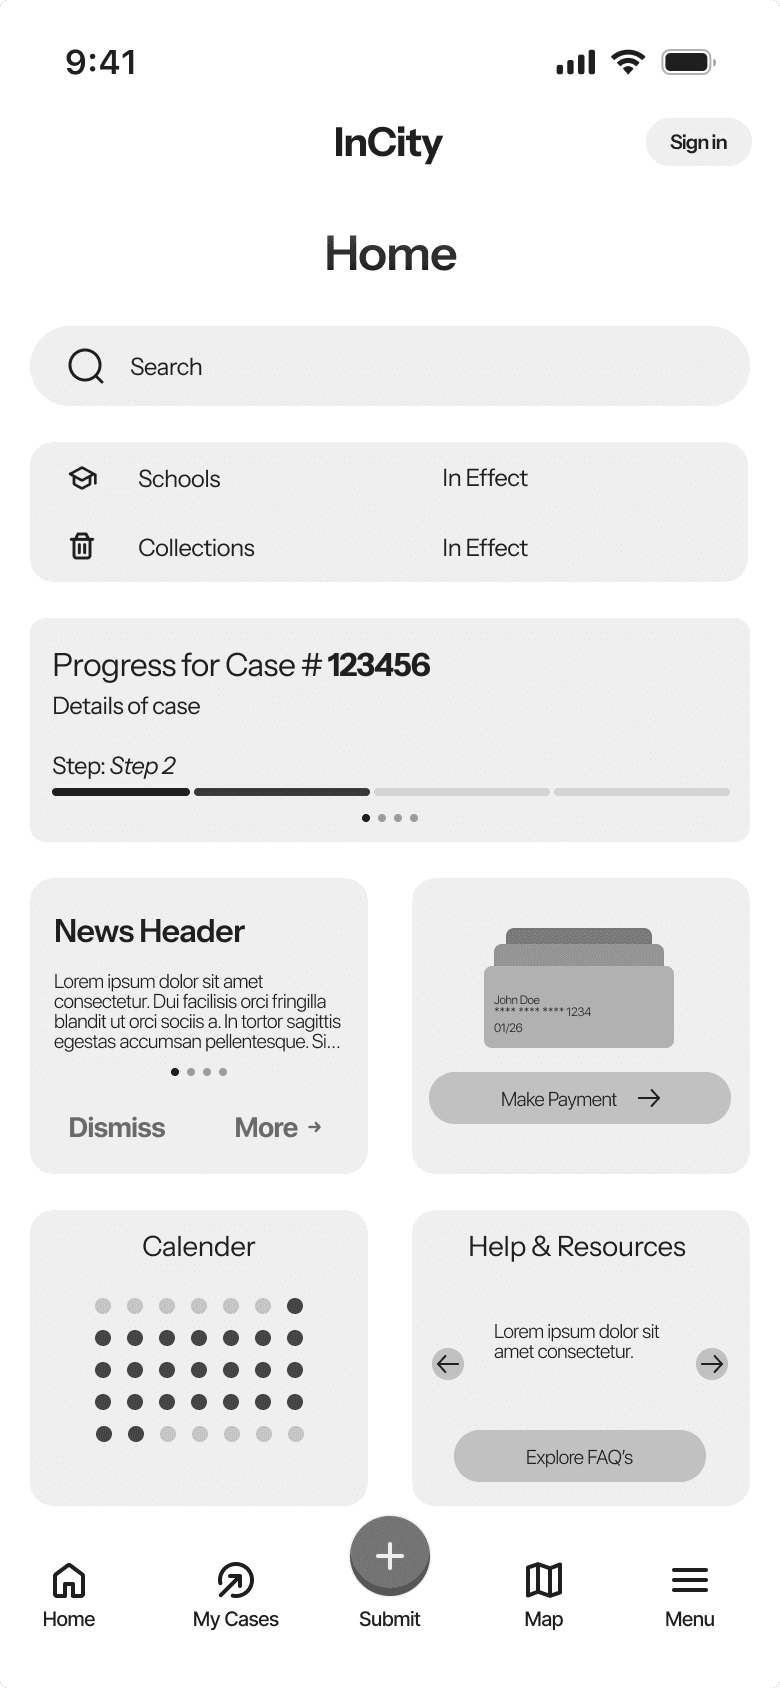
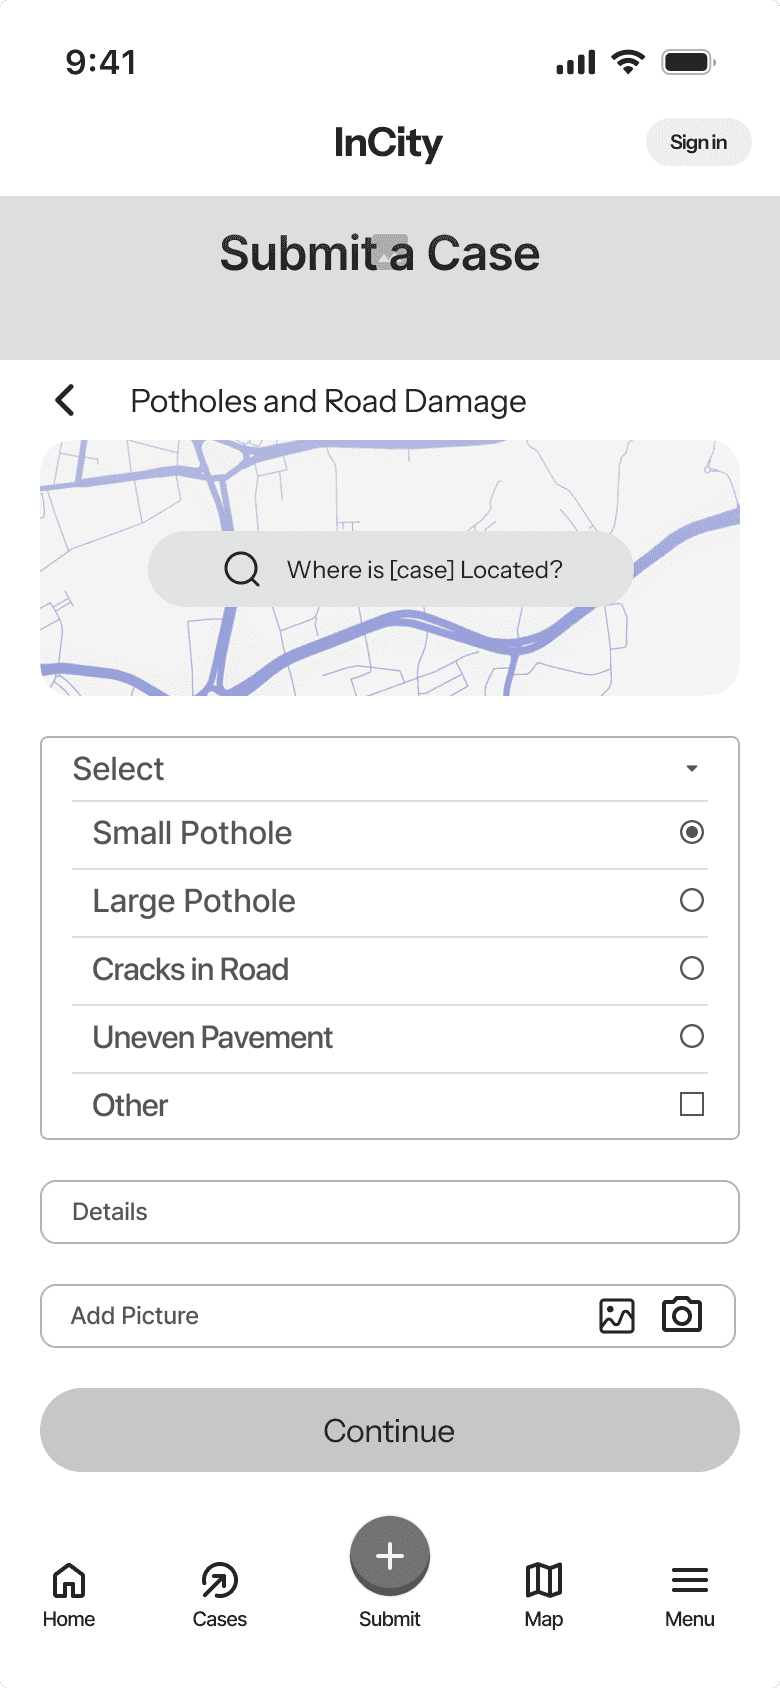
High-Fidelity Mockups
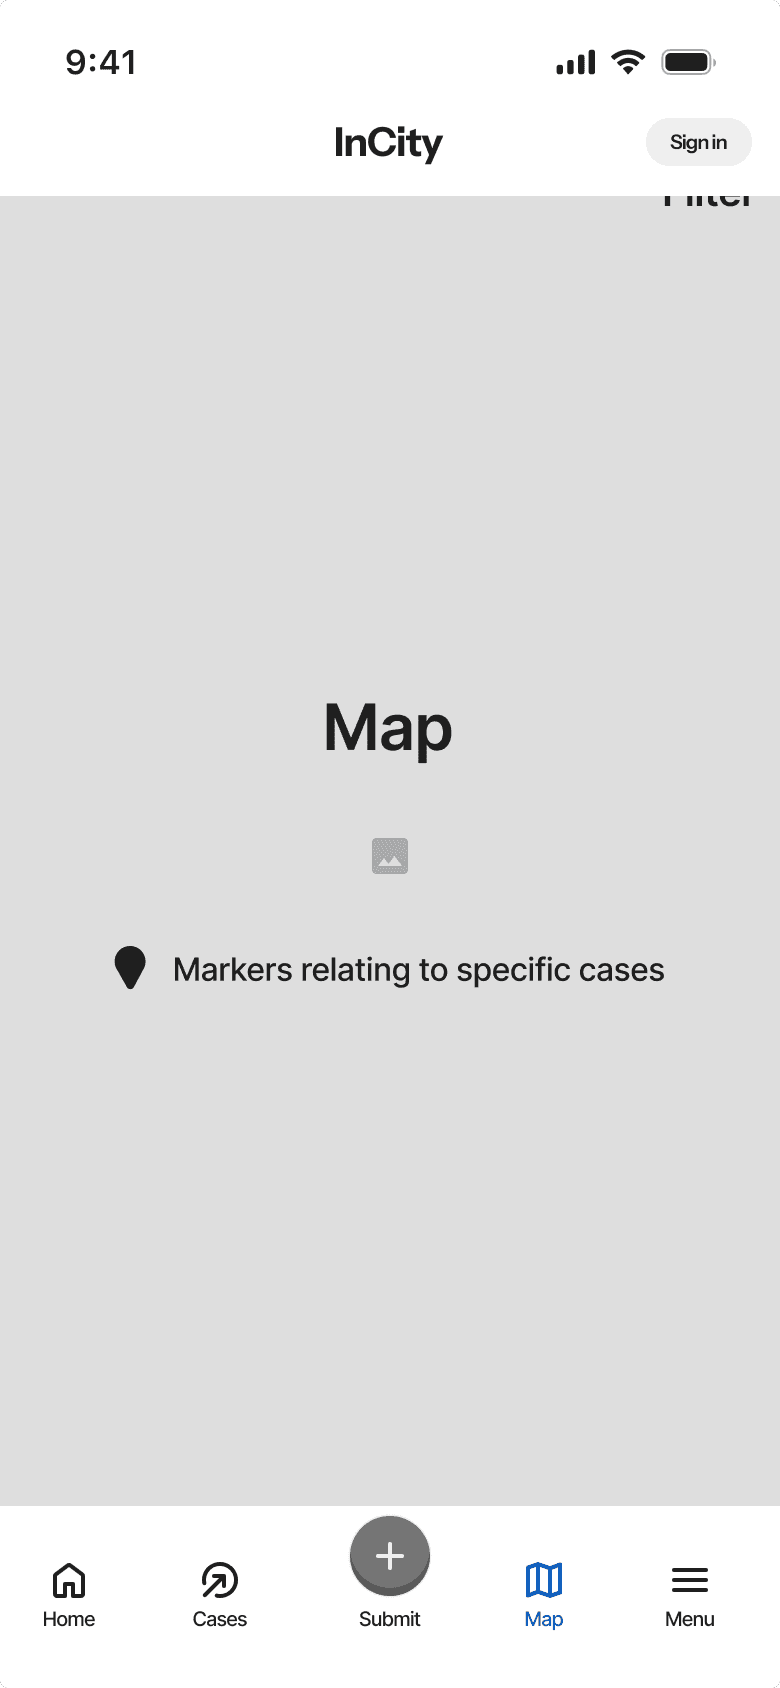
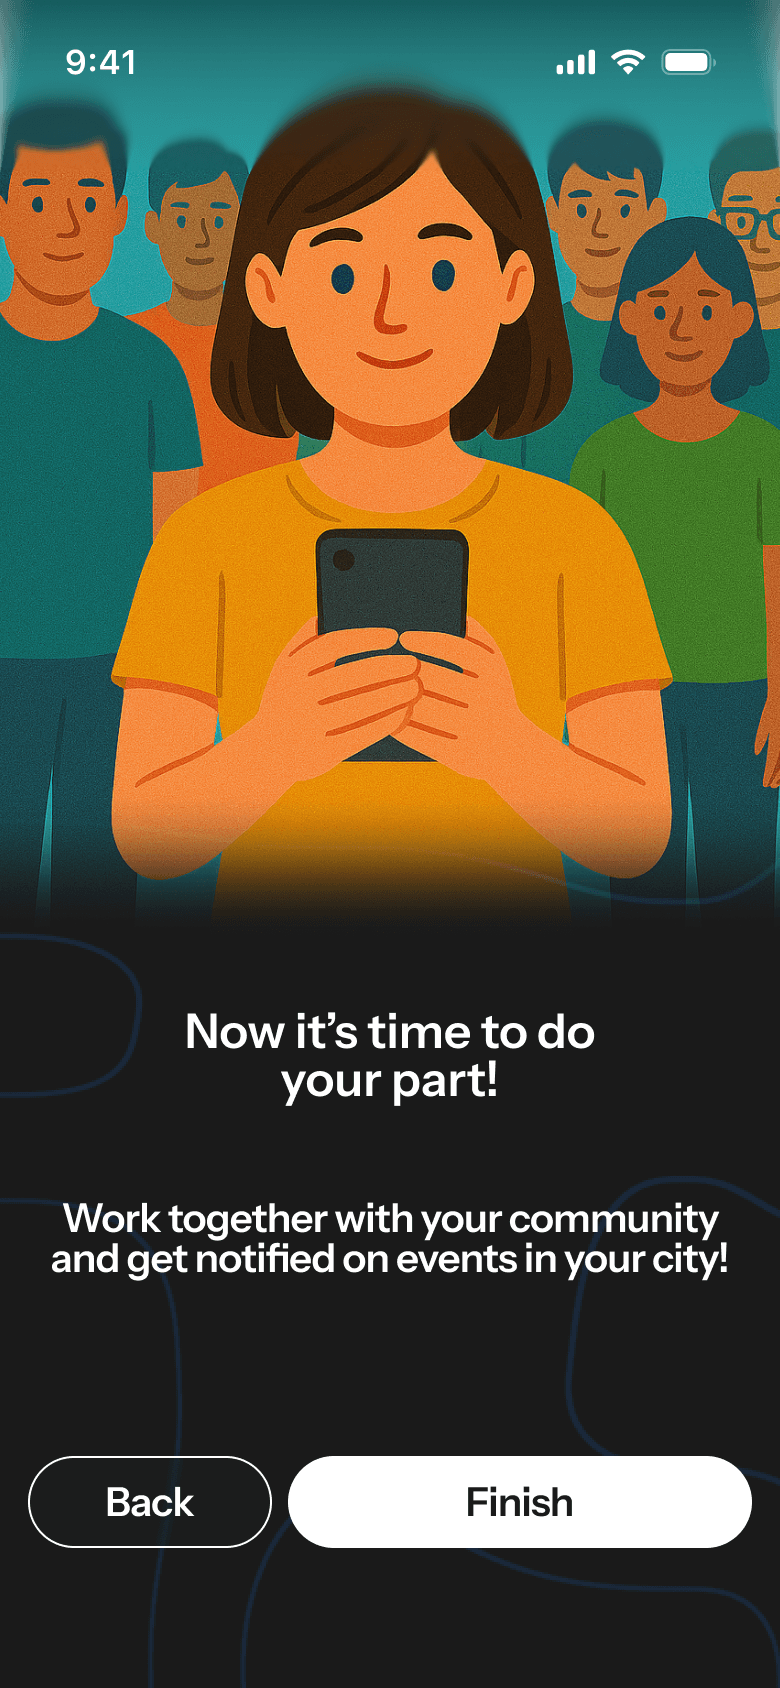
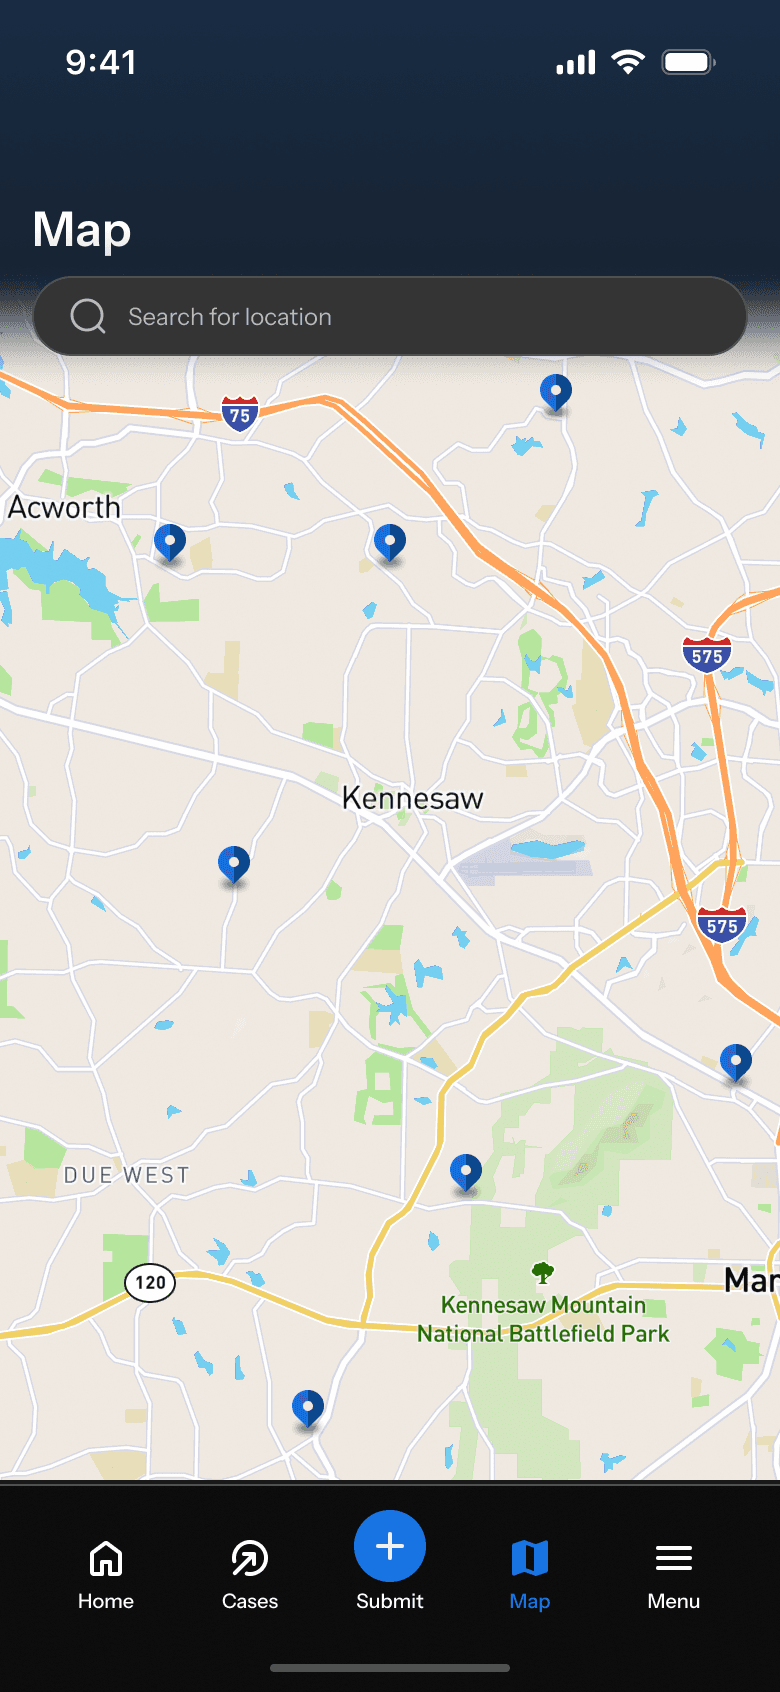
Building on those wireframes, I crafted polished Figma screens: soft teal accents (#00A3A3), large tappable icons, a with accessable geotag pin, dark/light mode toggles, and adjustable typography controls.
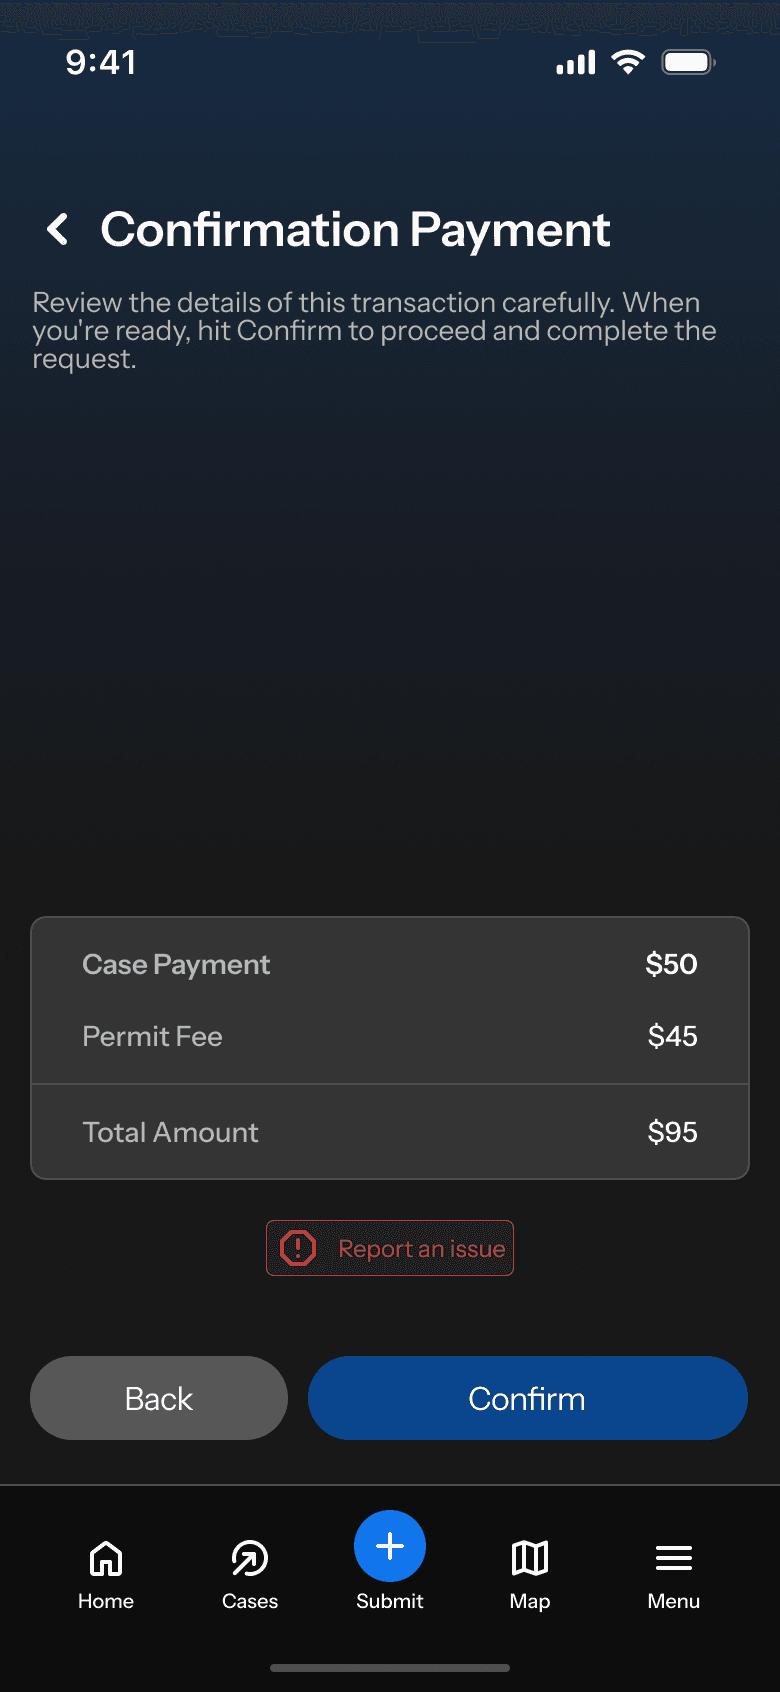
A horizontal progress bar guides users from “Submitted” to “Resolved,” and motion-graphic guidelines ensure subtle, helpful feedback on taps and swipes.
Drag


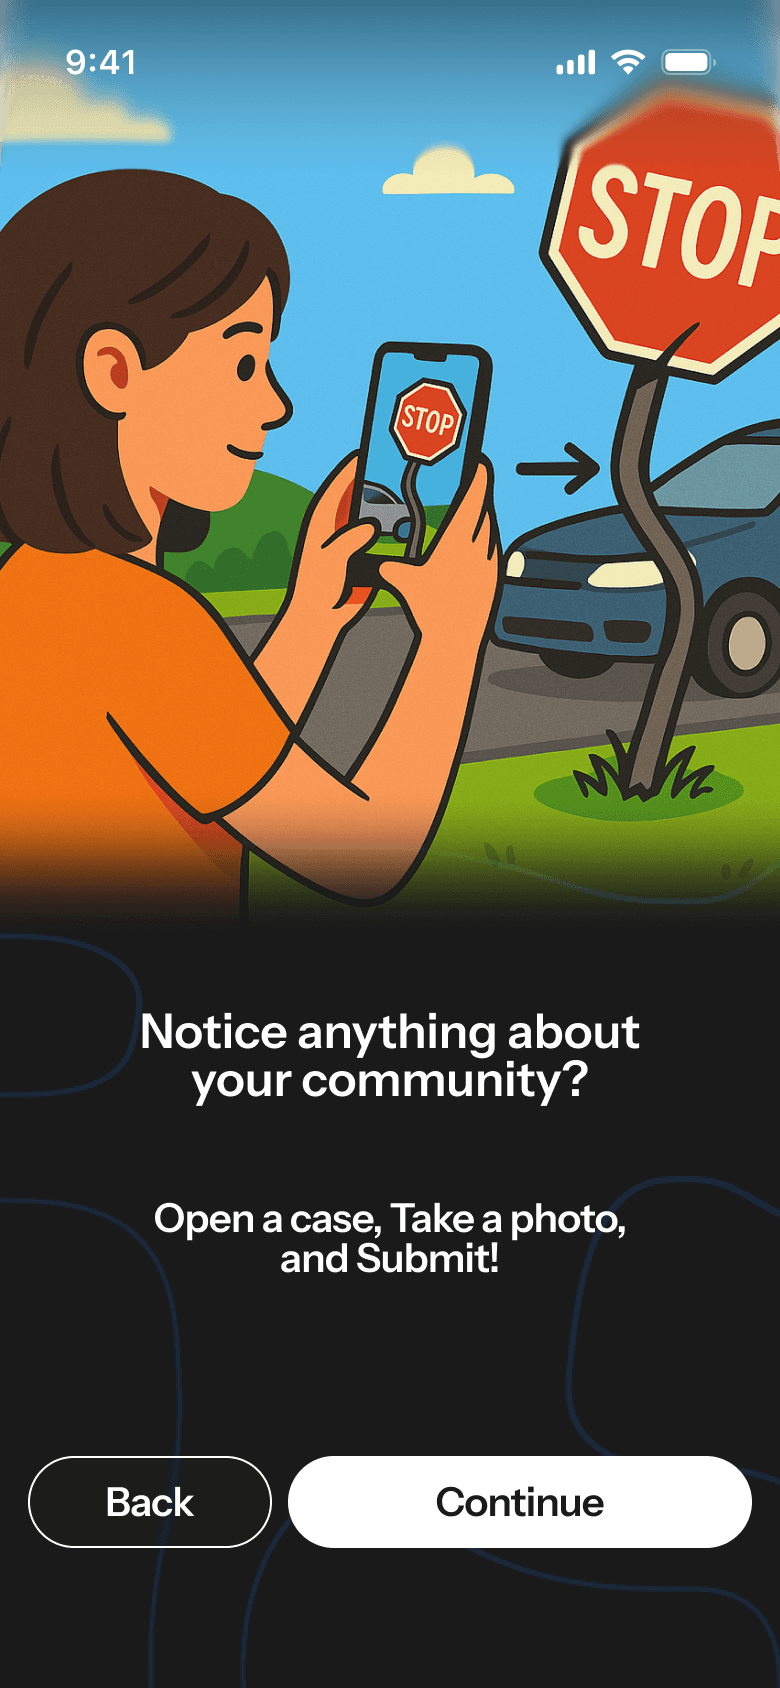
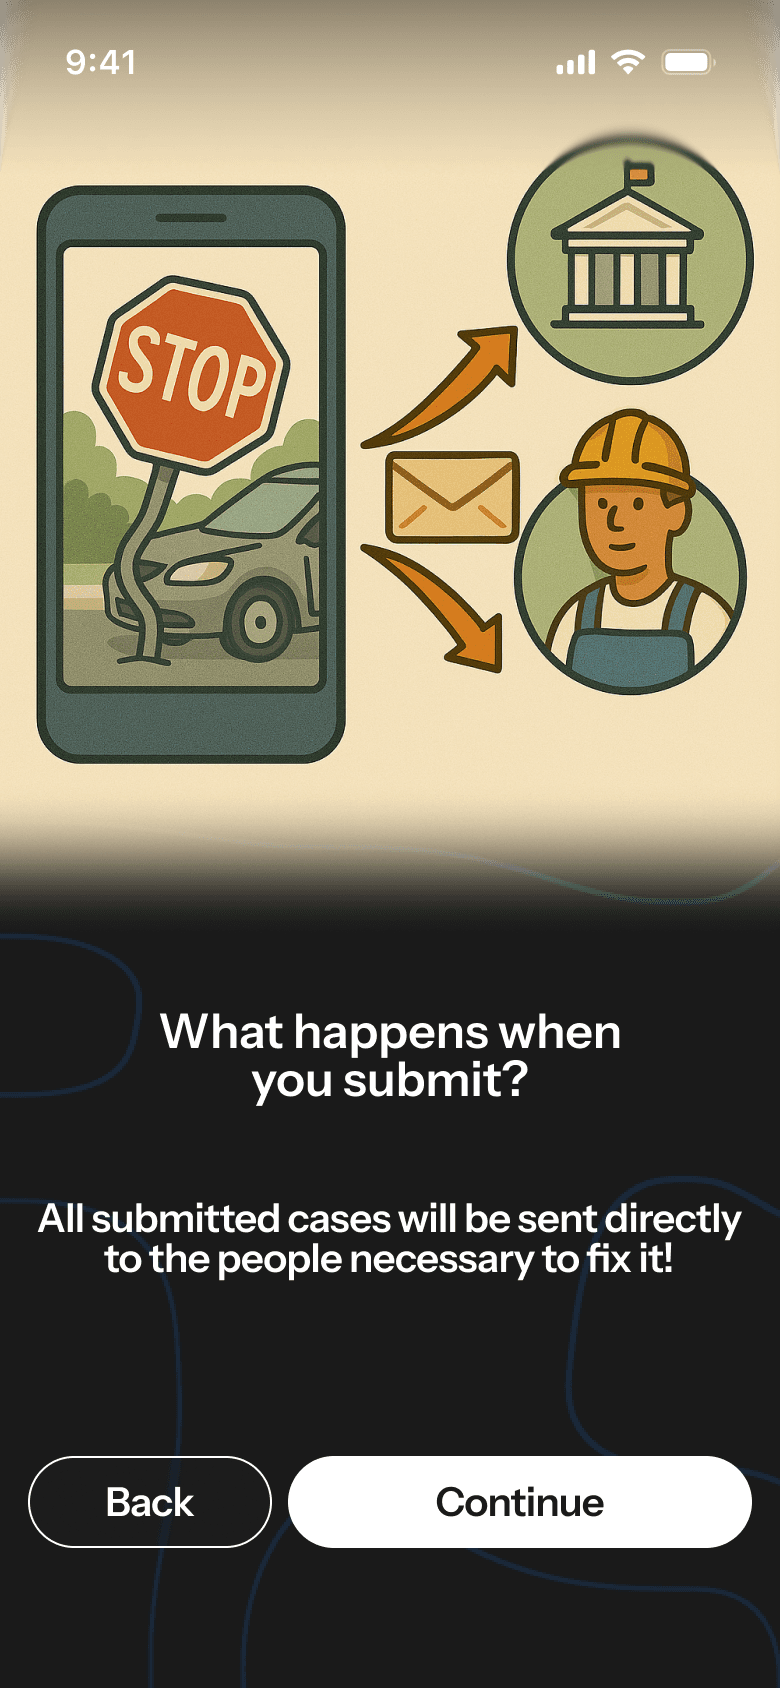
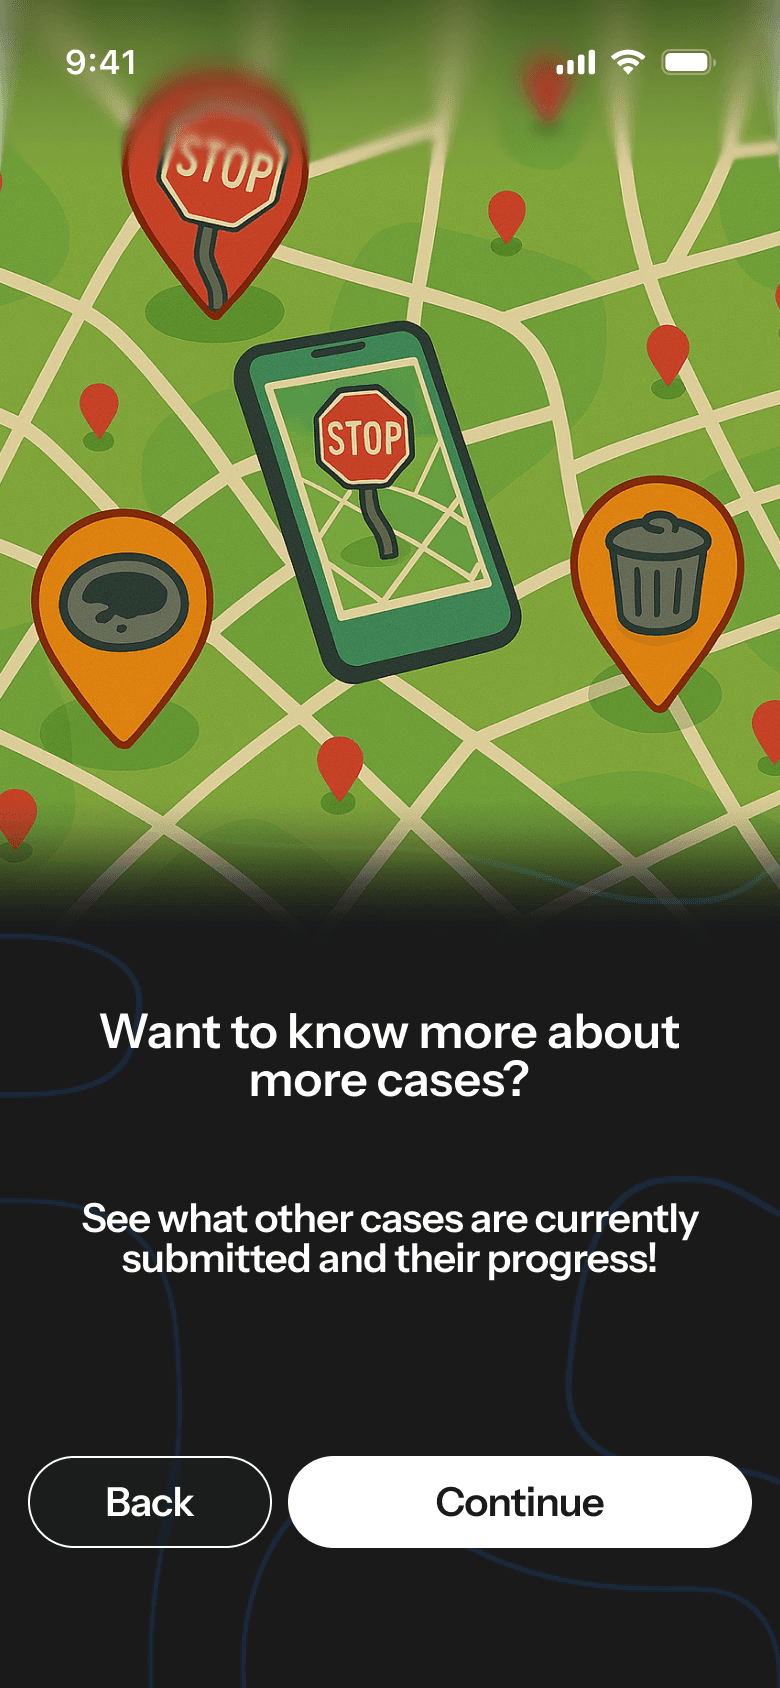
Interactive Prototype
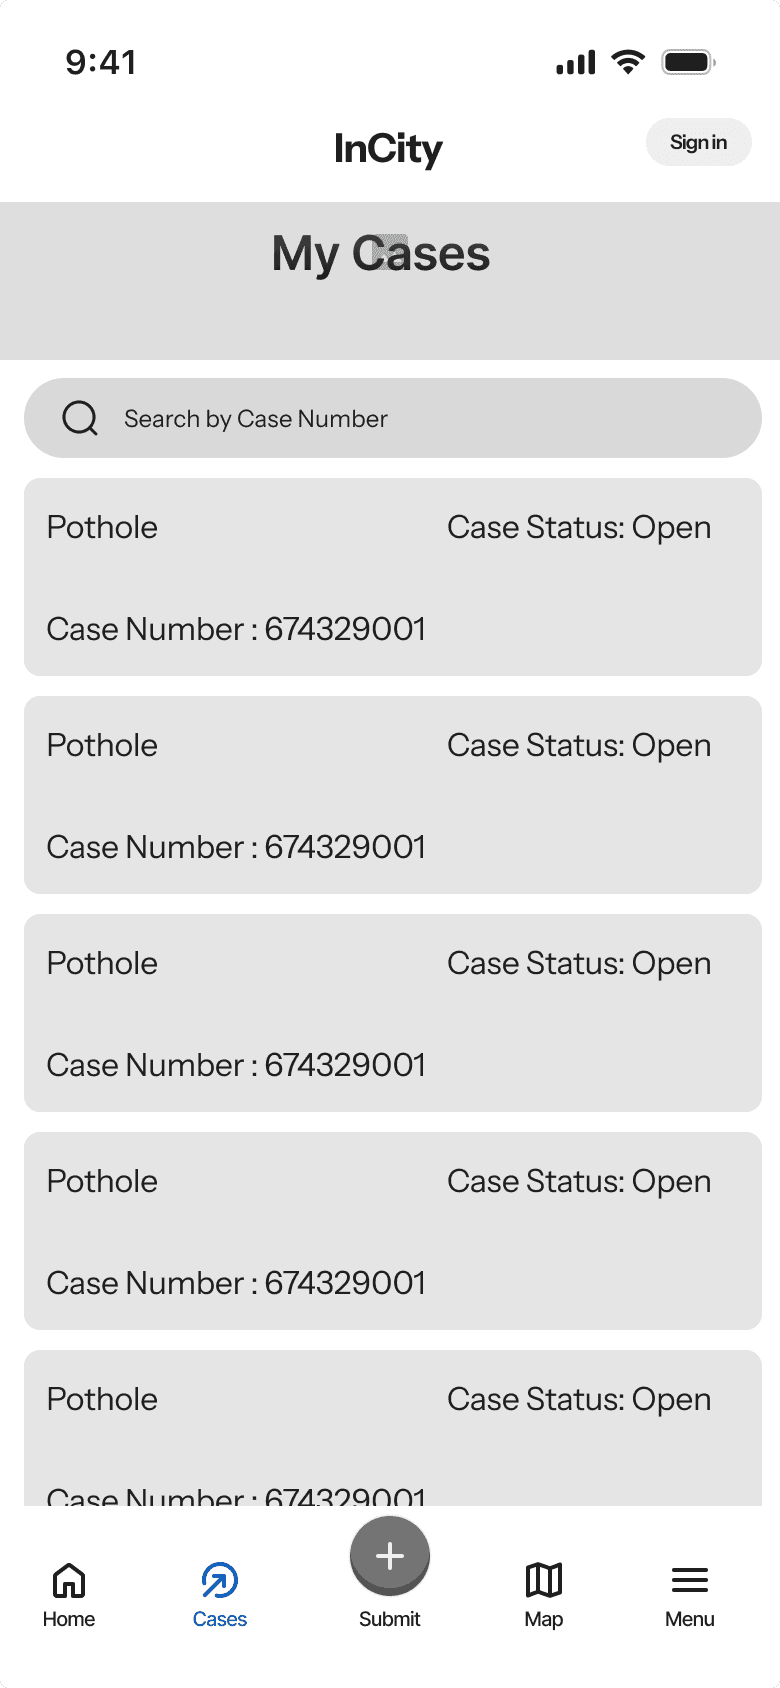
Our interactive Figma prototype simulated push notifications and community updates. In usability tests with eight participants, 90% filed a pothole report in under two minutes, and zero testers got stuck on category selection. Testers loved the possible “repeat last report” idea—a clear next step.
Usability Testing
Prototype testing drove a 28% boost in engagement and projected a 40 % faster resolution time. We delivered spec docs for dark/light themes, variable font-size rules, and motion-graphic guidelines.
Some notable future improvements: Offline reporting support and that “repeat report” shortcut to keep trust growing between residents and the city..
Final Design & Visual Details
Refined micro-animations: map pin bounce feedback; icons glow on tap; submit button transforms to checkmark.
Colors: soft teal (#00A3A3), charcoal gray, white backgrounds.
Font: Instrument Sans.
Explore the
Figma
File
Other projects
InCity: Community Based Compliance App
A redesign of the ATL311 platform to improve community reporting and compliance. Focused on geotagged reports, standardized checklists, and real-time transit updates.

Siren: Safety Oriented Dating App
A safety-first dating experience with proactive red-flag alerts and in-app verification to help you connect with confidence.

Logitech: Superlight Promotional Website
Product page showcasing the Logitech G PRO X mouse.
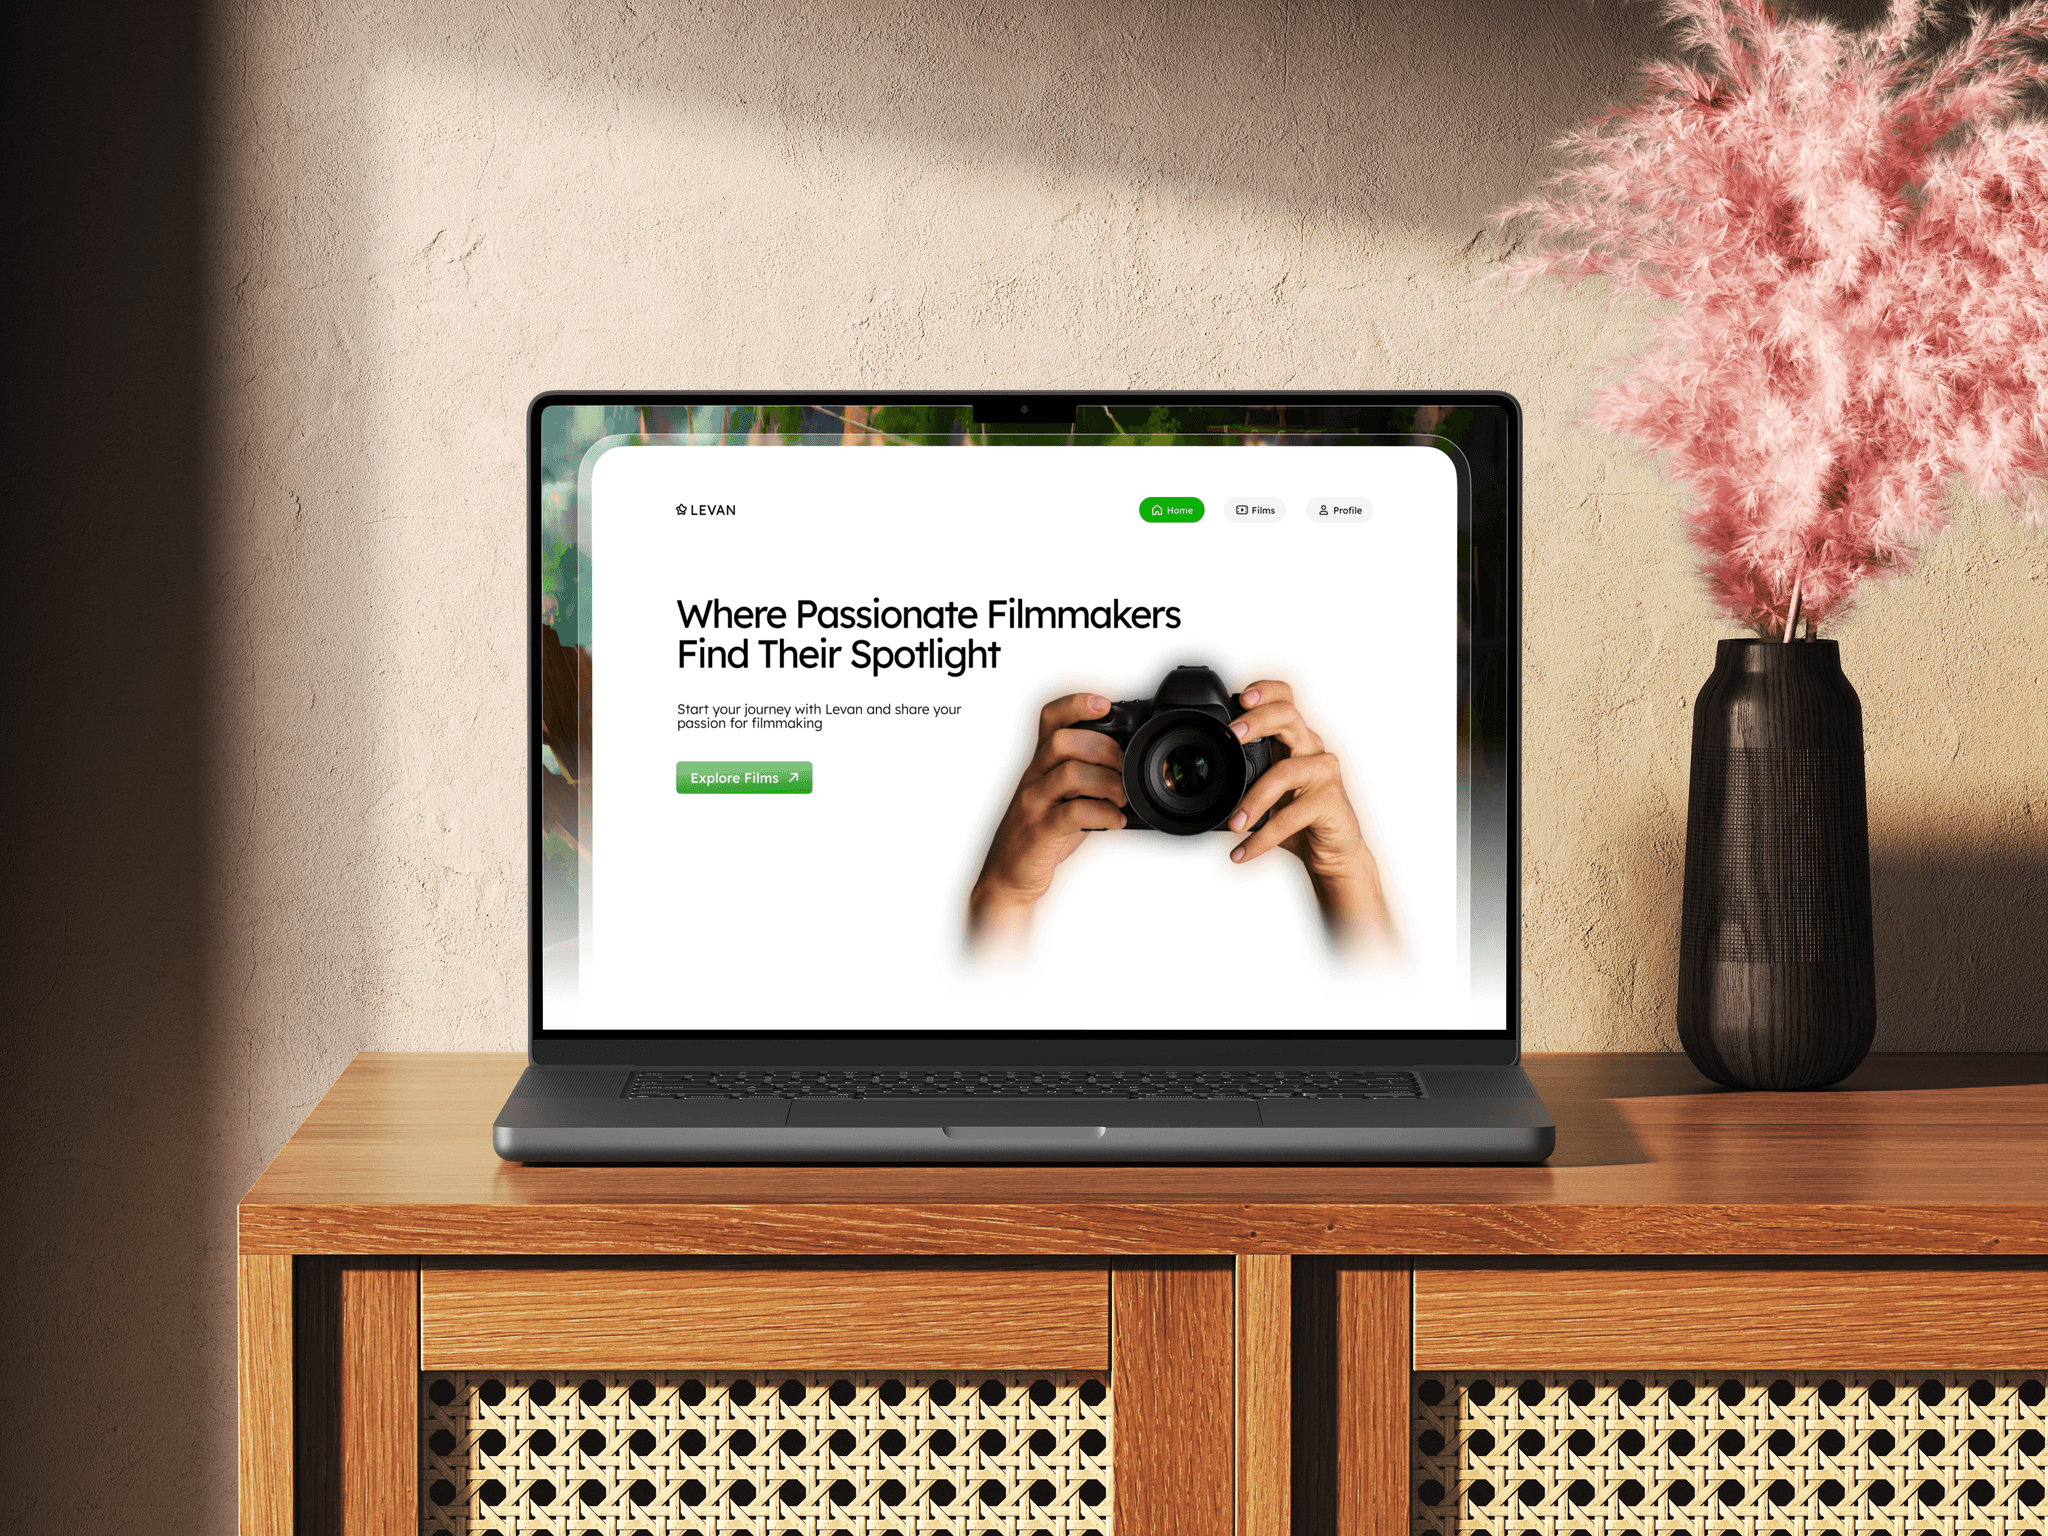
Levan: Film Catalog Platform
Curated space for short films and independent creators.